![]() 7.4 INVESTOR RISK PREFERENCES
7.4 INVESTOR RISK PREFERENCES
Preferences Over End-of-Period Wealth
We assume that investors care about their wealth at the end of the investment horizon. For simplicity, assume that the investment horizon is one period from now. Investors have available to them risky assets, such as stocks, in which they can invest their initial wealth.
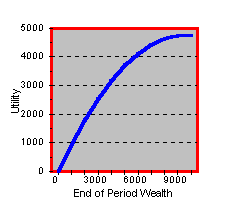
Let W denote the investors wealth at the end of the period. A general way to represent preferences is by means of a utility function, U(W). Risk-aversion means that U is a concave function of W, as shown in Figure 7.2.
Figure 7.2
Concave Utility Function

To see why concavity and risk-aversion go together, consider a risky investment which results in end-of-period wealth 3000 with probability 1/2 and 9000 with probability 1/2. The expected wealth is 6000, i.e. 6000 = (1/2)3000+(1/2)9000. A risk-averse investor prefers the sure wealth of 6000 to the risky investment with the same expected value. You can see in the Figure 7.2 that this is true for a concave utility function.
We assume that investors only care about the expected value and the variance of the end-of-period wealth. In terms of returns, this implies that only the mean and variance of the portfolio return matter to an investor. It turns out that if returns are normally distributed, then our assumption holds. This is because the normal distribution can be completely described by its mean and variance. We have previously seen an interesting argument supporting the assumption that returns are normally distributed (see central limit theorem and returns.
Without normally distributed returns, our assumption requires the utility function to be quadratic. The mathematical form for the quadratic utility function is U(W) = W - cW
2. Here, W is the final wealth that results from the portfolio's marked value, and c is some strictly positive coefficient of risk-aversion. The larger that c is, the more risk-averse the preferences are.Of course, not every choice of c is appropriate. To remain well-defined it must be assumed that more wealth is preferred to less wealth. Formally, this implies that the first derivative with respect to wealth is positive. The first derivative with respect to W of W - cW
2 is:1 - 2cW > 0
This requires c to satisfy
![]()
for all possible wealth levels that can occur.
Quadratic utility implies that any information not captured by the mean and the standard deviation of the distribution is irrelevant for investor behavior. We can express the general quadratic expected utility function into a function of the mean and variance of end-of-period wealth.
First, the expected utility of end-of-period wealth is
![]()
Since final wealth is a random variable,
![]()
Thus, in terms of the mean and variance, the quadratic expected utility function is:
![]()
Given our earlier restriction on c, this is an increasing function of the mean and a decreasing function of variance (or standard deviation squared). This produces the equation for an indifference curve, where expected utility equals some constant:
![]()
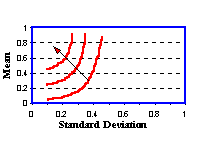
For a given constant, we can graph indifference curves, as in Figure 7.3 below. Observe that as you move along any indifference curve both the expected return and the risk are increasing. That is, to remain at the same level of expected utility an investor will need compensation with additional expected return for assuming additional risk.
Figure 7.3
Investors Indifference Map

The standard portfolio problem requires plotting portfolios in terms of their risk and return. Risk is defined as the standard deviation of returns, not wealth. We now describe how an indifference map is constructed for the standard portfolio problem.
Preferences Defined over Returns
In many cases, it is useful to work with a utility function defined directly over returns. In the case of quadratic utility, such a function is
![]()
As you may imagine, there is a close relationship between utility functions over wealth and those over returns. Our goal here is to start with a utility function defined over wealth, and to derive a utility function that is defined over returns.
Return is a concept that evaluates the change in wealth between two points in time. As a result, to transform preferences defined over end-of-period wealth into preferences defined over returns, we need to add a time subscript to wealth.
Terminal wealth is related to beginning period wealth as follows:
![]()
![]()
![]()
By expanding and rearranging the terms, we get the derived utility function:
![]()
You can see that the coefficient of risk-aversion, c, is now scaled relative to the beginning level of wealth by

An example of this construction is in topic 7.5, Three-Firm Case: Indifference Map.
previous topic
next topic
(C) Copyright 1999, OS Financial Trading System