![]() 6.9 DERIVATION OF THE SML
6.9 DERIVATION OF THE SML
Suppose you consider investing proportion
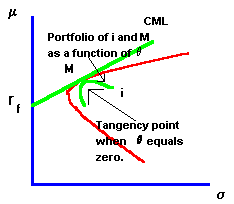
q of your wealth in security i and proportion (1 - q) in M. Portfolio M corresponds to the point of tangency between the capital market line and the efficient frontier of risky assets. Security i is any risky security in the set of risky securities. This would lead to the diagram in Figure 6, the inner curve drawn as a function of q.|
Figure 6.4 |
|
Derivation of SML |

Observe that two points of tangency coincide. The capital market line forms a tangency with the minimum-variance frontier at M. The inner curve is also tangent to the minimum-variance frontier at M (where
q = 0 ).The expected return from the portfolio of security i and portfolio M is
![]()
and the risk (i.e., standard deviation) of this portfolio is
![]()
We can calculate how the expected return and variance change as a function of
q. To do this requires us to differentiate both the expected return and the portfolio risk with respect to q. If we differentiate both the expected return and the portfolio standard deviation with respect to q, we find that:![]()
![]()
The ratio of these derivatives evaluated at
q = 0 gives us the slope of the inner line at point M.

Since all three lines are tangent at M, this slope at
q = 0 is equal to the slope of the capital market line. Graphically, this is given in Figure 6.4 (or by clicking on graphical derivation. The slope of the CML equals:
Equating the slopes, and rearranging to solve for the expected security return i, we get:
![]()
where

is called the "beta" of security i.
previous topic
next topic
(C) Copyright 1999, OS Financial Trading System