![]() 5.4 ISOMEAN AND ISOVARIANCE TANGENCY POINTS
5.4 ISOMEAN AND ISOVARIANCE TANGENCY POINTS
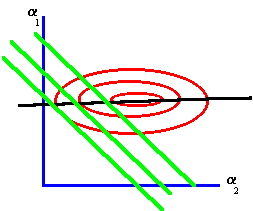
When the isomean and isovariance graphs are overlaid on one another you will see points of tangency. Such points make up the critical line. The critical line gives you the portfolio weights that minimize risk for every target return.
|
Figure 5.4 |
|
Tangency Points and Critical Line |

In Figure 5.4 the critical line is the line passing through the center of the ellipses. By applying CAPM Tutor you can trace out the critical line by first clicking on the Frontier button and then clicking on different points along the minimum-variance frontier. The risk and return associated with each portfolio that you choose is displayed in the data entry window. Finally, the points of tangency between the isomean and isovariance curves trace out the corresponding critical line.
A special case of a isomean and isovariance tangency point is discussed next in the topic minimum-variance portfolio.
previous topic
next topic
(C) Copyright 1999, OS Financial Trading System