![]() 1.7 FINANCIAL ANALYST APPROACH
1.7 FINANCIAL ANALYST APPROACH
Suppose you are an investor in our three-firm world. You have some wealth that you would like to invest for one year in the stock market. You would like to get as much return as possible from your investment, but you are cautious about holding a portfolio with returns that could fluctuate a lot.
In order to make your investment decision, you need information about what return you can expect and how variable these returns can be. To acquire this information, you obtain the services of a financial analyst.
The analyst studies the sensitivity of each firm to the general state of the economy, and produces for you a report.
The Analyst's Report
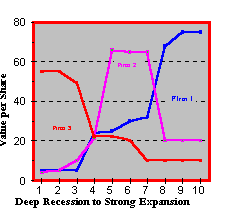
At the end of the year the economy will be in one of ten possible states. Each state has an equal chance of occurring. These states range from a deep recession (there is high unemployment and negative personal income growth) to expansionary (there is full employment and high personal income growth).
We have conducted extensive research on the relationship between the state of the economy and year-end stock values. This research includes a detailed examination of the financial statements of the companies, consensus earnings forecasts as disclosed by the Earnings Reporter newsletter, government forecasts of economic conditions, and a variety of domestic and international factors.
Figure 1.3
Projected End of Period Value

The numbers behind the graph are in the following table.
|
1 |
2 |
3 |
4 |
5 |
6 |
7 |
8 |
9 |
10 |
Mean |
|
|
Firm1 |
5 |
5 |
5 |
24 |
25 |
30 |
32 |
68 |
75 |
75 |
34.4 |
|
Firm2 |
4 |
5 |
10 |
21 |
66 |
65 |
65 |
20 |
20 |
20 |
29.6 |
|
Firm3 |
55 |
55 |
49 |
22 |
22 |
20 |
10 |
10 |
10 |
10 |
26.3 |
No firm is planning to pay a dividend over the next four quarters.
Capital Markets
In the capital market, you can trade the stocks of the three firms and can also buy and sell a one-year risk-free bond. Currently, the bond is yielding a 12% annual return. Your stock price reporting service shows that Firm 1 is trading at $28, Firm 2 at $26, and Firm 3 at $25. Since you plan to trade only a small number of shares, you will be able to buy or sell the stocks at these prices.
Expected Returns
From the forecast values and the current prices, you can construct the distribution of returns. The return in state s for Firm 1, say r
1(s), is defined as follows. Let F1(s) be Firm 1's year-end stock value in state s and P1 its current price (P1 = 28). Then,
For example, in state 6, the return would be (30 - 28)/28 = 0.07. By completing similar computations for each firm and state, you would obtain the following return distribution.
|
State |
1 |
2 |
3 |
4 |
5 |
6 |
7 |
8 |
9 |
10 |
Expected Return |
Standard Deviation |
|
Firm1 |
-0.82 |
-0.82 |
-0.82 |
-0.14 |
-0.11 |
0.07 |
0.14 |
1.43 |
1.68 |
1.68 |
0.23 |
0.96 |
|
Firm2 |
-0.85 |
-0.81 |
-0.62 |
-0.19 |
1.54 |
1.50 |
1.50 |
-0.23 |
-0.23 |
-0.23 |
0.14 |
0.93 |
|
Firm3 |
1.20 |
1.20 |
0.96 |
-0.12 |
-0.12 |
-0.20 |
-0.60 |
-0.60 |
-0.60 |
-0.60 |
0.05 |
0.73 |
Because the analyst's report indicates that each state is equally likely, you can calculate the expected return from each stock and also the variances and covariances of the returns. To learn about the definition of these statistics and how they are constructed, you may want to read the topic 2.3, population statistics, in Chapter 2. For the Three-Firm Case, the computations lead to:
|
Expected Return |
Standard Deviation |
Covariance (i,j) |
(i,j) Pair |
|
|
Firm1 |
.229 |
.961 |
.063 |
(1,2) |
|
Firm2 |
.138 |
.928 |
-.582 |
(1,3) |
|
Firm3 |
.052 |
.727 |
-.359 |
(2,3) |
We describe how a financial statistician approaches the investment problem in the topic financial statistician.
previous topic
next topic
(C) Copyright 1999, OS Financial Trading System