![]() 5.2 ISOMEAN LINE
5.2 ISOMEAN LINE
Suppose you are choosing the weights for three securities. Because the sum of the portfolio weights equals one, you can immediately reduce this problem to two dimensions by substituting out the portfolio weight for security 3.
There are many portfolios that provide a given return. You can find these using CAPM Tutor's default three-firm data set. An Isomean line is defined as the plot of portfolio weights that provide a constant target return.
Construction of the Isomean Line
Substituting for the portfolio weight for security 3 from
![]()
we get
![]()
This lets us write the target portfolio return in two dimensions, that is, as a function of only two portfolio weights:
![]()
By rearranging this equation, we can solve for all portfolio weights that provide a target return.
![]()
We can express this equation in the "standard form" y = mx + b of a straight line, where m is the slope and b is the intercept. In terms of portfolio weights, let y =
a2 and x = a1. You can then solve for m and b to obtain the straight-line relationship between portfolio weights on an isomean line:![]()
Construction for Three-Firm Case
For our Three-Firm case,
![]()
![]()
so
![]()
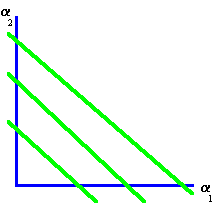
Thus the Isomean line has a negative slope and an intercept that depends on the target return. Different Isomean lines are depicted graphically in Figure 5.2.
|
Figure 5.2 |
|
Isomean Lines |

In CAPM Tutor you can see how the Isomean lines behave in response to changing the target return. Alternatively, by first clicking on the button
Frontier, the minimum-variance frontier will appear. You can then click on different portfolios along this minimum-variance frontier to see how the Isomean lines behave in response. As you move up this frontier the corresponding target return for each portfolio increases.In this CAPM Tutor exercise an ellipse graph also changes in response to a changing target return. The next part of this chapter characterizes the behavior of the isovariance ellipse.
previous topic
next topic
(C) Copyright 1999, OS Financial Trading System